
Highlight Photo
Challenge Project: Quantification of glycan abundance from mass spec data
Targeted approach
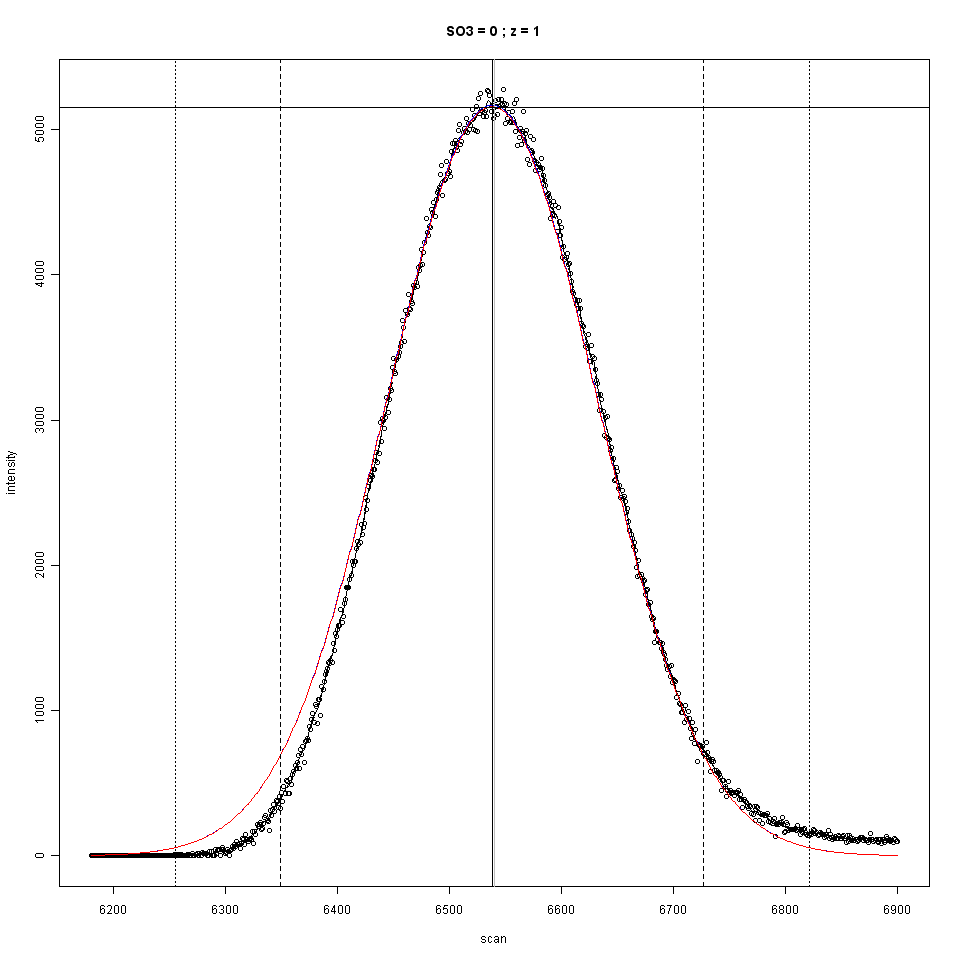
Fig 2. Another view of the mass spectrometry data, this time, a “mountain” representing the abundance of one carbohydrate. A smoothed curve is fit to the plot points of the abundance over time. x-axis: time of measurement (retention time); y-axis: intensity (number of molecules). For carbohydrate data, mountains are not easily detected by standard software. Instead, predictions of their locations (using experimentally-validated empirical data and marked here by dotted gray lines) are employed in the targeted approach developed by Jacobs, Dreyfuss, and Gindin.
Credits: Christopher Jacobs, Jonathan Dreyfuss, Yevgeniy Gindin, Joseph Zaia