
Highlight Photo
Challenge Project: Quantification of glycan abundance from mass spec data
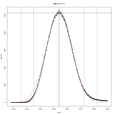
Comparison of Manual and Software Results

Fig 3. Relative abundances of targeted carbohydrates. Blue: results from previous work performed manually in Professor Zaia’s lab at Boston University School of Medicine. Red: results from the new software developed by Jacobs, Dreyfuss, and Gindin, first year graduate students in the IGERT funded Bioinformatics Program at Boston University. Note the high correlation between expert manual calculation of abundance and software calculation. Manual calculation takes WEEKS. Software calculation takes MINUTES. (x-axis: carbohydrate; y-axis: percent of total abundance (normalized for the represented carbohydrates.)
Credits: Christopher Jacobs, Jonathan Dreyfuss, Yevgeniy Gindin, Joseph Zaia