
Highlight Photo
Challenge Project: Quantification of glycan abundance from mass spec data
Glycomics Mass Spectrometery Data

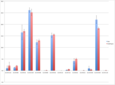
Fig 1. Visualization of mass spectrometry data. x-axis: ratio of molecular mass to electrical charge (mass-to-charge ratio); y-axis: time of measurement (retention time); color: number of molecules detected (red indicates more). In the data shown here, only a few of the red regions correspond to carbohydrates of interest (and some of the not-as-red regions are also of interest). It is hard and time-consuming work to extract the relevant data ?by hand.?
Credits: Christopher Jacobs, Jonathan Dreyfuss, Yevgeniy Gindin, Joseph Zaia