
Highlight Photo
Actin Interacting Protein 1 and Actin Depolymerizing Factor Drive Rapid Actin Dynamics in Polarized Plant Cells
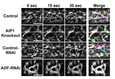
Figure 2. Quantitative Analysis of Actin Dynamics in AIP1 and ADF loss-of-function plants.
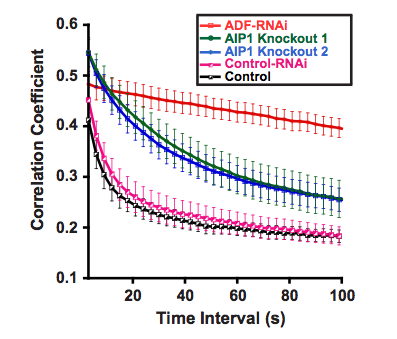
The correlation coefficient between images was calculated at all temporal spacings (time interval). Low correlation values correspond with higher actin dynamics. Error bars represent SE.
Credits: Robert Augustine