

Highlight
Flow Anomaly: Informatics Approaches to Localize Pollution Sources
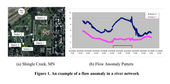
Figure 1. An example of a flow anomaly in a river network
Achievement/Results
The two disciplines of computer science and environmental engineering worked together to discover novel and interesting spatio-temporal patterns called Flow Anomalies (FA) within water quality datasets that were collected from Shingle Creek, MN (Figure 1a). At Shingle Creek, there contains five water quality sensors; two located within the creek (Stations 5 and 1) and three located in neighboring ponds (Stations 2, 3, and 4). The dotted lines depict the direction of flow between stations.
In general, FAs represent periods of time that show significant discontinuity between spatially neighboring time-series. For example, a FA may represent a contaminant entering the river network. Discovering FAs is an important problem in environmental flow monitoring networks and early warning detection systems for water quality problems. However, mining FAs is computationally expensive because of the large (potentially infinite) number of time instants of measurement and potentially long delays due to stagnant (e.g. lakes) or slow moving (e.g. wetland) water bodies between consecutive sensors. In this work, we proposed a Smart Window Enumeration and Evaluation of persistence-Thresholds (SWEET) method to efficiently explore the search space to find all interesting patterns.
Figure 1b gives an example of a flow anomaly that has been found by our SWEET method within Shingle Creek, MN. The water quality parameter that was used in this study was dissolved oxygen. In general, dissolved oxygen gives the amount of oxygen that was measured at every time instant. Within this study site, the largest flow anomaly (i.e., longest time period) started to occur on June 4, 2008 at 1:06pm and ended on June 5 at 7:34pm (denoted by the red box in Figure 1b). Based on this flow anomaly, the upstream station 5 gave a high value of dissolved oxygen, whereas the downstream station 1 had a low value. Also it was observed that the amount of rain measured at the station was significant during the same period of the flow anomaly. Based on the environmental scientists, it was observed that the retention ponds located to the left of the river in Figure 1a contained a significant low amount of oxygen. Thus, when a large amount of rain fell, it overflowed the ponds and emptied into the river between stations 5 and 1. This resulted in a low amount of dissolved oxygen to be entered into the river and then observed at station 1. In essence, this flow pattern was treated as a hypothesis made by the technique developed in computer science and validated by environmental scientists using real datasets. With this collaboration, further hypothesis can be analyzed to discover novel and interesting phenomena within river network datasets.
J. M. Kang, S. Shekhar, C. Wennen, P. Novak, Discovering Flow Anomalies: A SWEET Approach, In the Eighth IEEE International Conference on Data Mining (ICDM ’08), pp. 851-856, Pisa, Italy, December 15-19, 2008.
Address Goals
Flow anomaly detection algorithm may enhance the cyber-infrastructure for processing water quality sensor datasets collected at many US sites and compiled at Hydrological Information System (HIS).
