
Highlight Photo
Investigating the unique properties of multiscale particles for pharmaceutical applications
Figure 3. NMR images of bimodal suspensions in contraction-expansion flow.
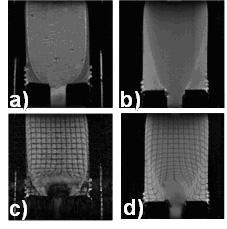
NMR images from (a,c) 40% large/11% small volume fraction bimodal suspension; (b,d) 50% volume fraction monomodal suspension (large). (a,b) spin-echo intensity images; (c,d) time-of-flight tagging velocimetry. FOV=3×3cm, slice thickness=1mm. Flow direction is upward.
Credits: Nina Shapley, 2008