
Highlight Photo
Using EEG and machine learning to predict action goals
Time frequency plots and statistics for EEG data
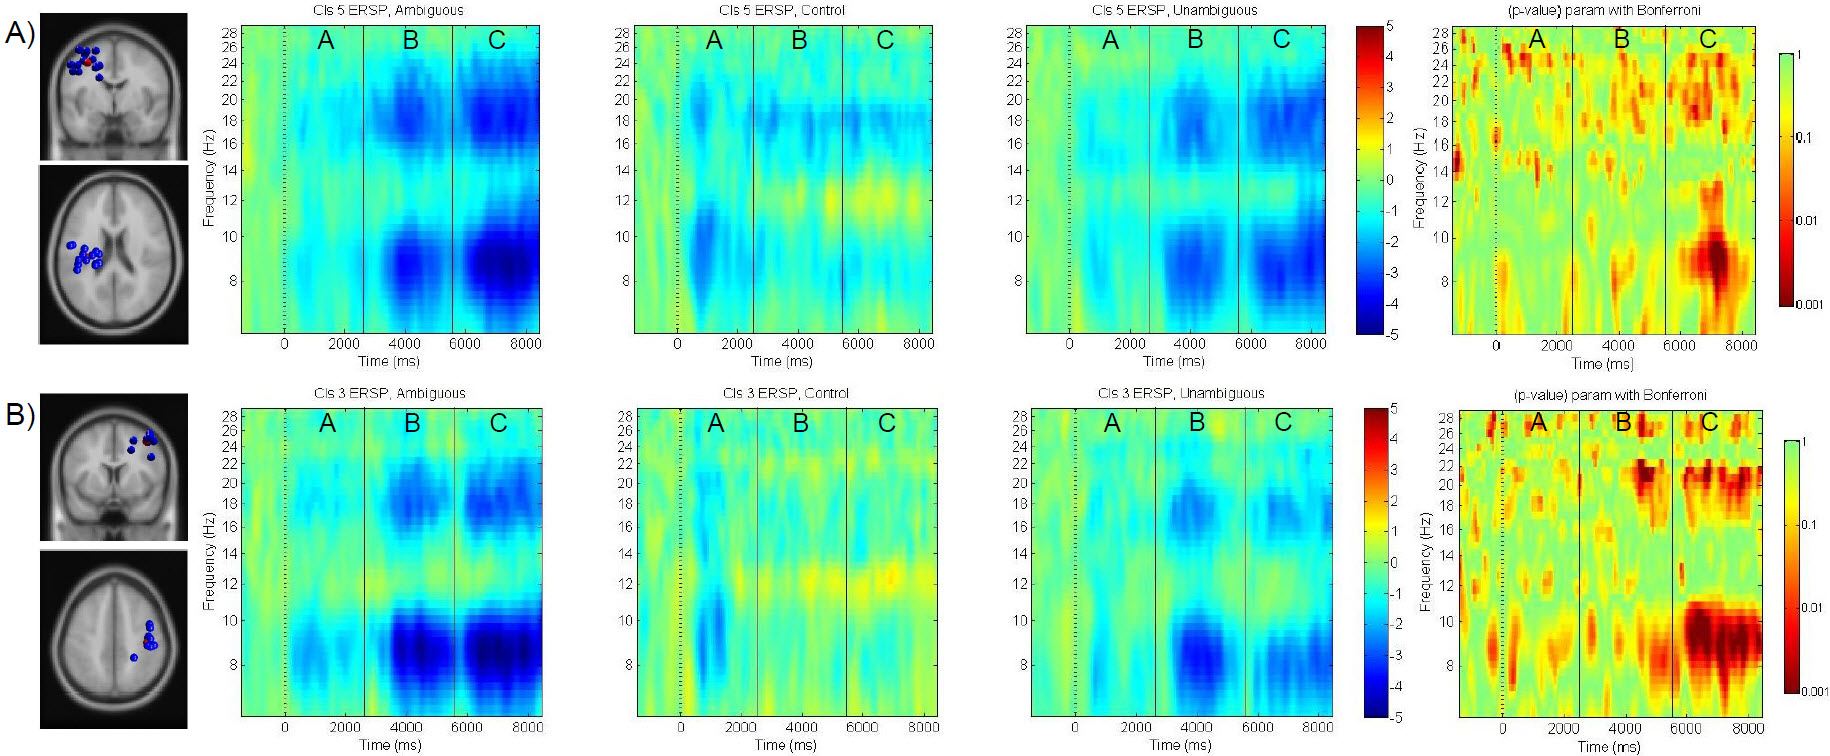
Time frequency plots and statistics for A) left and B) right motor component clusters (within 15% residual variance) across intervals (A, B, and C) for ambiguous, control, and unambiguous conditions. There was a condition x interval interaction in the mu- (8 10 Hz) and beta bands (16 22 Hz) for both left and right clusters. Mu-ERD during ambiguous conditions was significantly stronger than unambiguous and control during interval C. Ambiguous and unambiguous conditions were significantly stronger than control during intervals B and C in both the mu- and beta-bands.
Credits: Washington State University Smart Home IGERT Program