
Highlight Photo
New Spectral Analysis Algorithms Enable Robust Measurement of Flexural Rigidity of Biopolymers
Fluorescence Contour Fitting Procedure Schematic
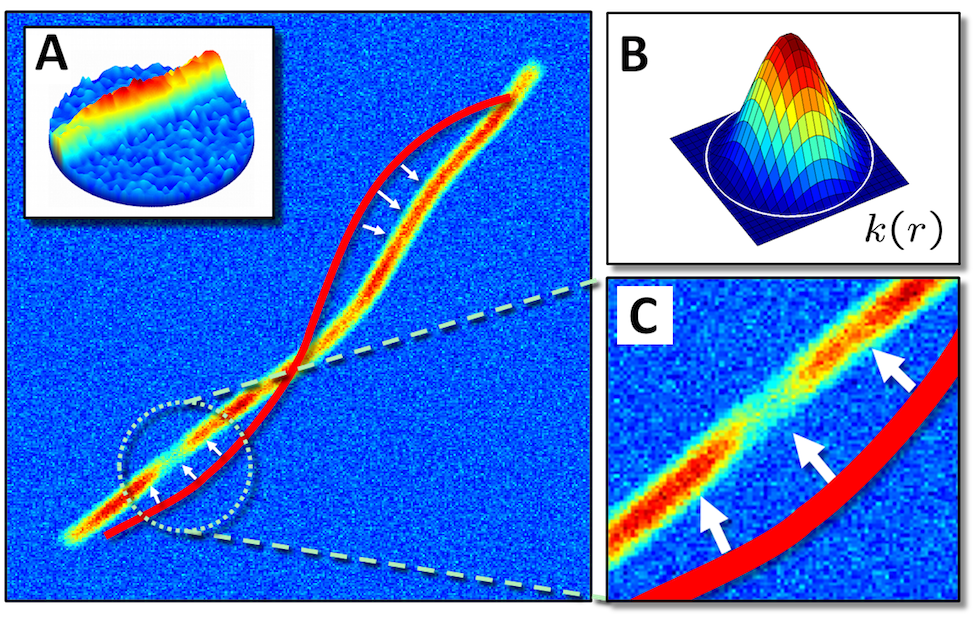
An overview of the image analysis procedure for fitting a continuous contour onto the fluorescence signal of an experimental fluorescence MT image. A) An initial fit is shown in red that is iteratively perturbed to align with the fluorescence signal. B) The image processing kernel C) Zoomed in view indicating the direction the initial contour moves.
Credits: David Valdman, Paul Atzberger