
Highlight Photo
Single Particle Tracking on Live Cells
Single-particle tracking of individual quantum dots non-specifically adhered to a glass coverslip
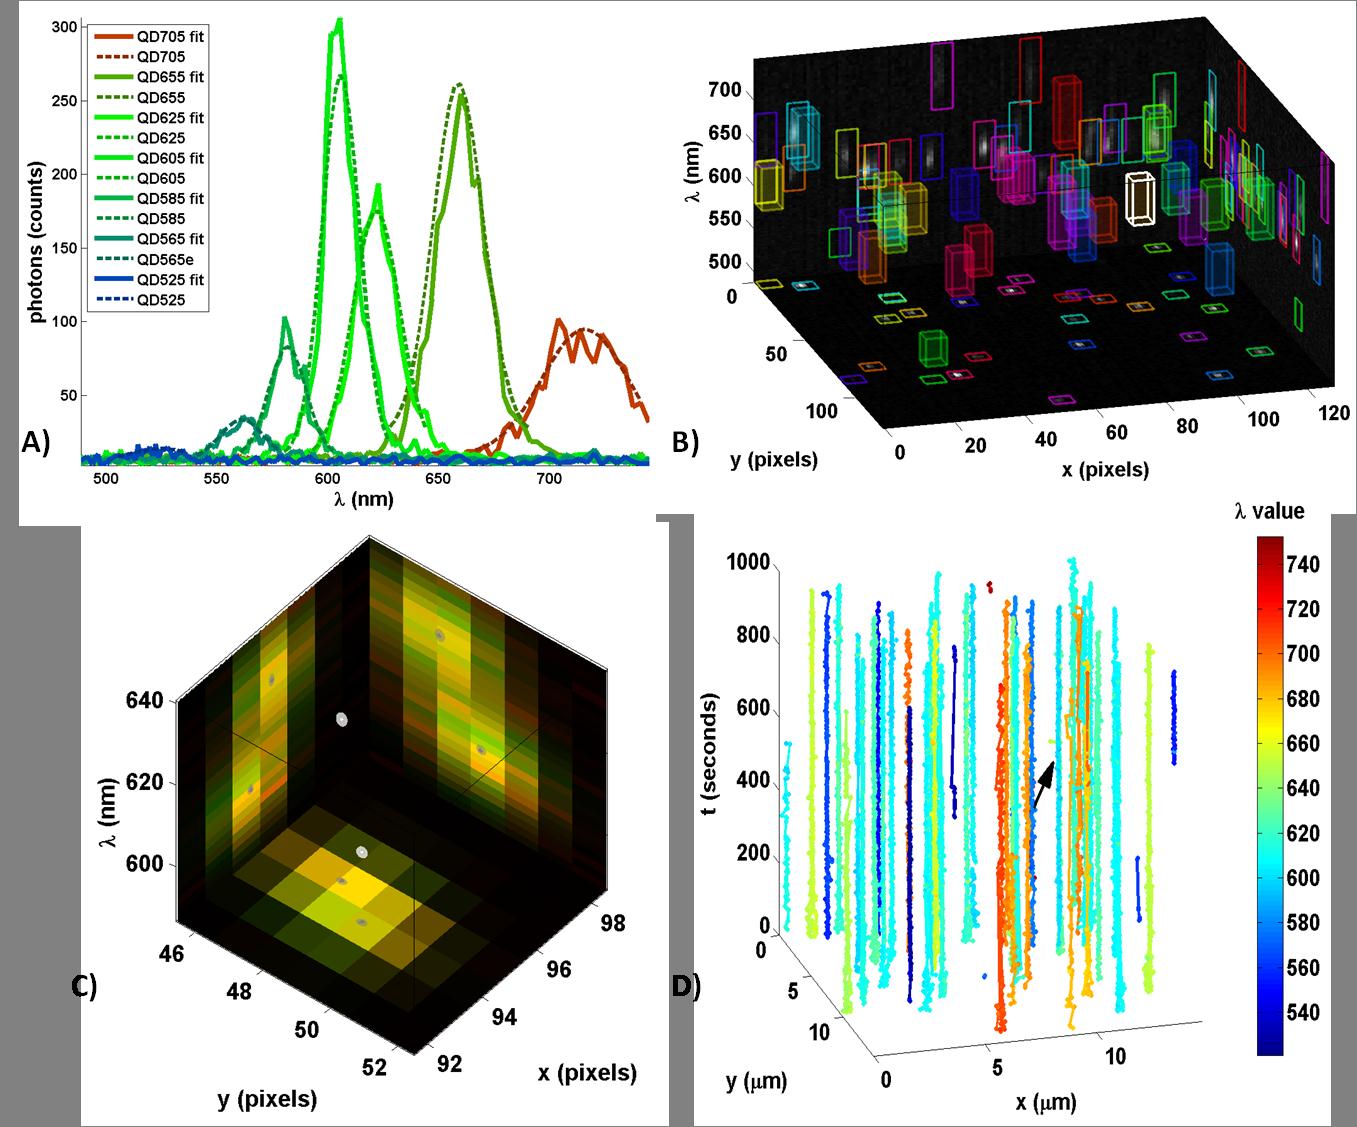
A) Progressing from blue to red are sum projections of raw data (solid) and fit data (dashed) for single 525, 565, 585, 605, 625, 655, and 705 QDs. B) 3-D subregions selected from a single hyperspectral frame for further localization are represented by colored 3-D boxes. Sum projections of the data onto each plane are used to represent the data. Likewise, 2-D projections of each 3-D box onto each plane are used to highlight the subregions. Fitting results for the subregion with white edges in B) are shown in C), where red and green are sum projections of the data and the fit, respectively. The localized particles are represented by white ellipsoids, in which the radius in each dimension represents 3 standard deviations in the estimated error in the fit using the Cramer Rao lower bound, while their projection onto each axis is represented by a gray ellipsoid. Single particle trajectories built from localizing particles in all frames for the same data as in B) and C) are shown in D). The
Credits: Patrick Cutler – University of New Mexico