
Highlight Photo
UW-Madison Trainee Shows That Biking Represents a Four Way Environmental Win
Results of air quality analysis for PM2.5 and O3 by location
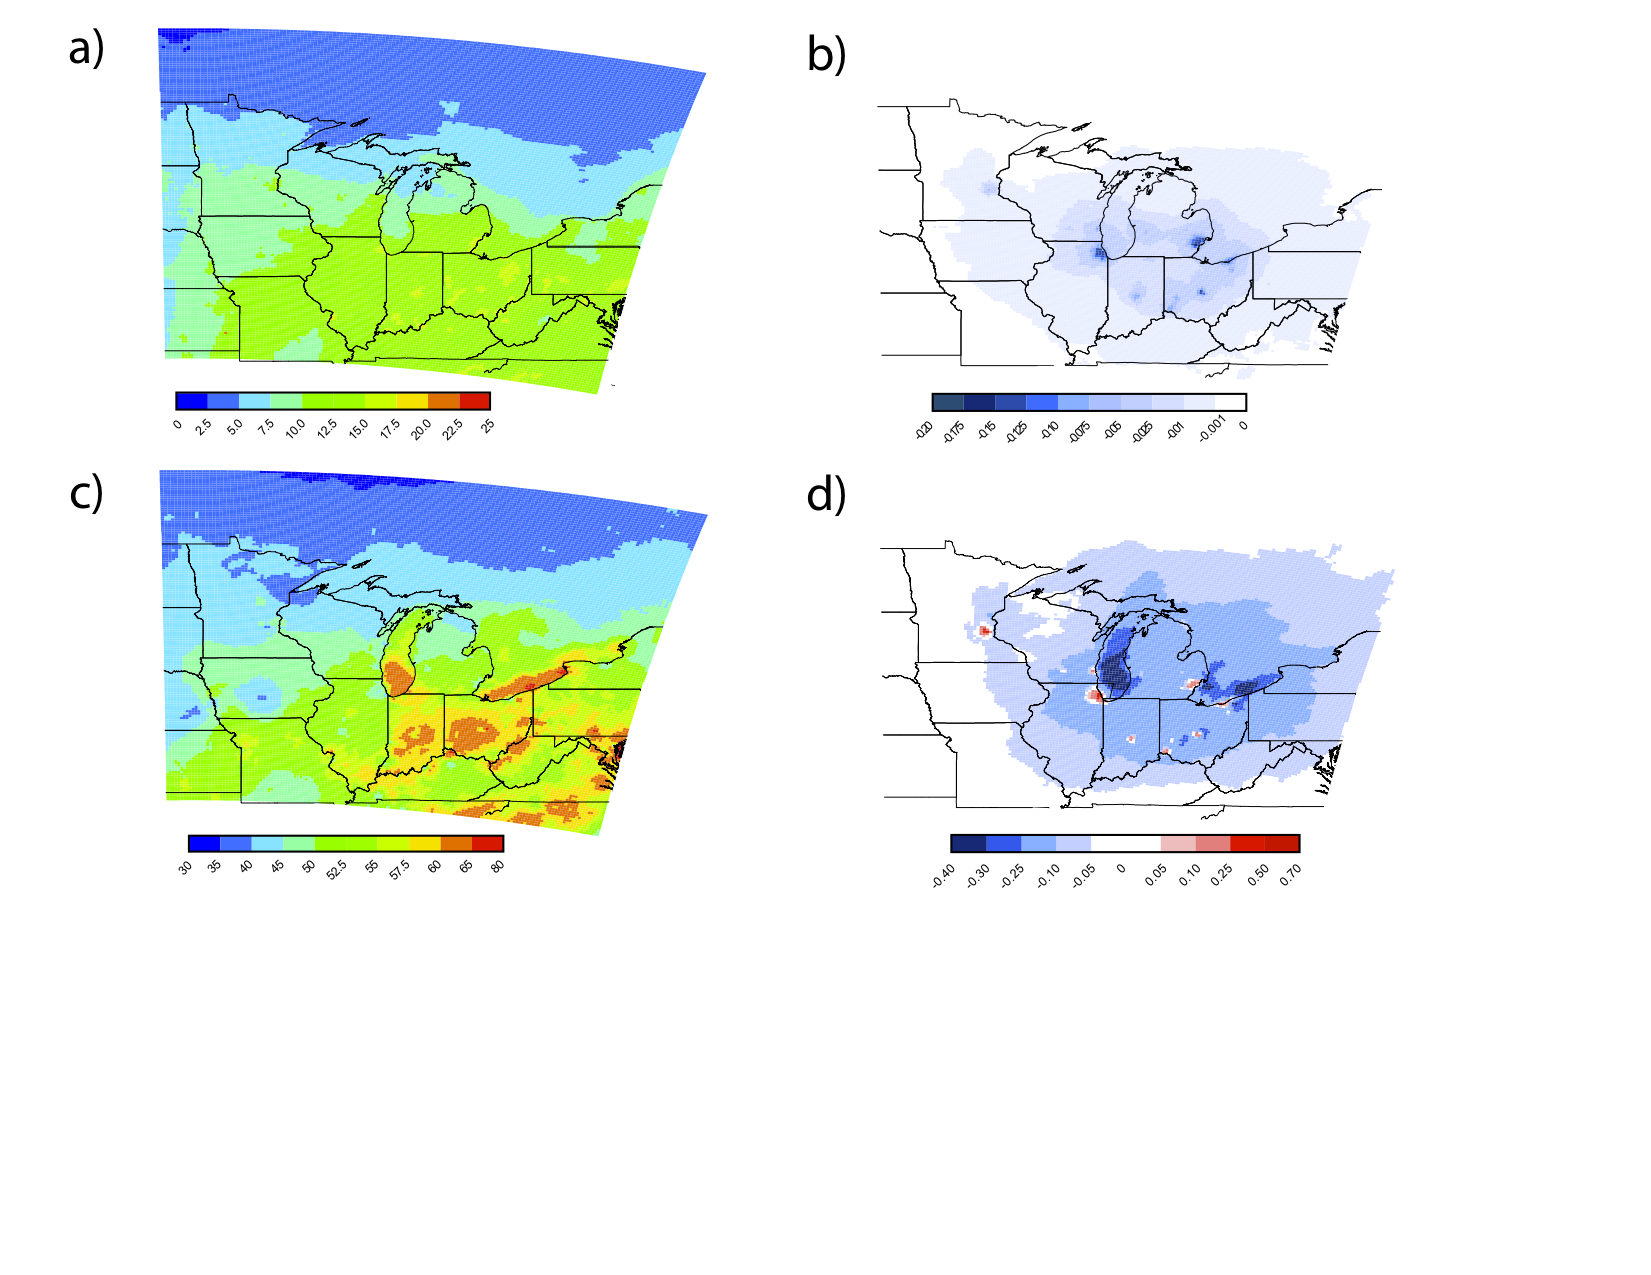
Figure 1. Results of air quality analysis for PM2.5 (A,B) and O3 (C,D) by location. (A) 2002 annual average PM2.5 concentration (g/m3). (B) Estimated reduction in 2002 annual average PM2.5 concentration (g/m3) due to changes in urban and suburban mobile emissions. © 2002 average daily 8-hr maximum O3 concentration (ppb) for the O3 season (1 May30 September). (D) Estimated change in 2002 average daily 8-hr maximum O3 concentration (ppb) for the O3 season due to changes in urban and suburban mobile emissions. Data were generated in BenMAP 4.0 and mapped in ArcGIS 10 (ESRI, St. Paul, MN).
Credits: Grabow ML, Spak SN, Holloway T, Stone B, Mednick AC, Patz JA.