

Highlight Photo
Bringing Smart Home Data to Caregivers
Activity dashboard
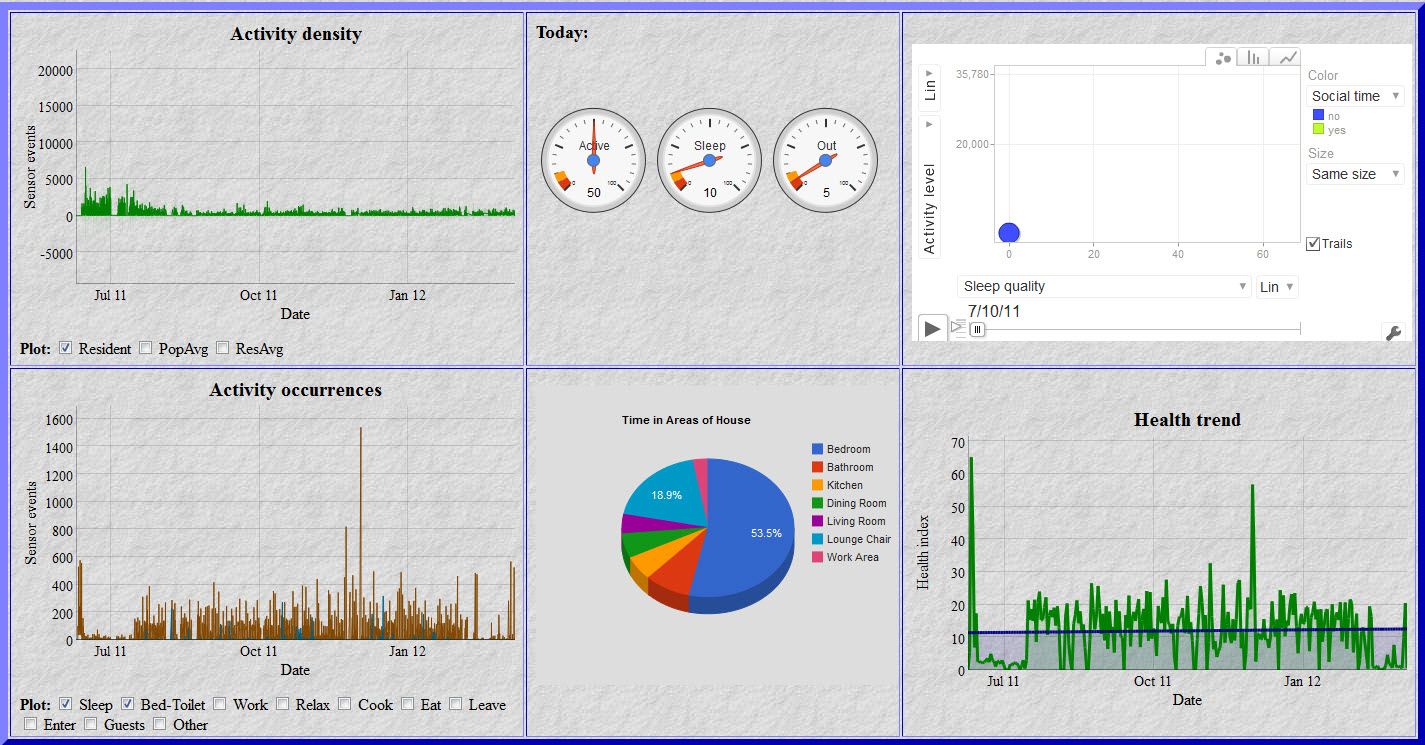
The activity dashboard provides a quick look at the resident’s behavior for a period of time. The upper left shows overall activity level, upper middle shows level of critical parameters, upper right facilitates comparison of parameters for multiple individuals, lower left indicates times automatically-recognized activities are performed, lower middle shows where time is spent in the home, and lower right shows health trend. The graphs can be zoomed in and out to look at different time windows.
Credits: Washington State University, CASAS Project
