
Highlight
Design of Flexible Smart Home Visualization Tools
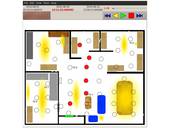
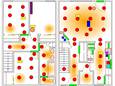
PyViz rendering of smart home installation
Achievement/Results
With the advent of modern smart home technologies, the ever increasing complexity of the available data makes it difficult for humans to understand the current working of the systems around them. These new smart homes have been developed to support green technologies, medical applications and techniques to support aging in place. The wide variety and volume of data generated by the sensor platforms need to be made available in a format the human users can understand to bring these technologies to their full potential.
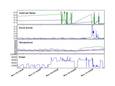
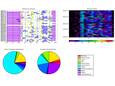
As part of our IGERT program, student Brian Thomas has designed and evaluated a suite of visualizers. These range from statistical mappings of the sensor state to complex 3D models. Our smart home visualizer, PyViz, leverages the Python programming language and standards-based configuration formations to provide a feature-rich, rapidly deployable method of viewing the smart home system in real time as well as provide access to historical trends.
Address Goals
Since its inception, having a platform that lends itself to rapid development has allowed PyViz to be a keystone of the our smart home research. It is now used during all stages of our smart home installations, including planning, installation, live operation and historical assessment. Part of its flexibility has been its ability to draw from multiple data sources, including the CASAS Lightweight Middleware (CLM), SQL databases and local files. Additionally, as new artificial intelligence algorithms are developed to model the smart home, such as Activities of Daily Living detection, resident tracking or behavior modeling, the current state of those models can quickly be rendered to the PyViz interface. Having such a versatile tool available has been invaluable to the continued research and deployment of smart home technologies. Examples of these tools can be found online at http://ailab.wsu.edu/casas/tools.