
Highlight Photo
Spatial-temporal model of platelet deposition and blood coagulation under flow
FIGURE 2
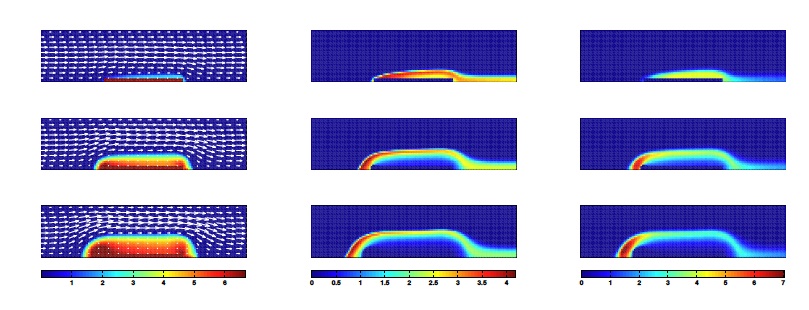
From top to bottom, time elapsed in the simulation is 200, 400, and 600 seconds. The left panel is number density of bound and activated platelets in the platelet mass. The velocity field of the flow is overlayed to illustrate how the growing platelet mass alters the flow. The middle and right panels show the number of platelets activated during the previous ten seconds by thrombin and ADP, respectively. From left to right, the units are number of platelets times 10^7, 10^6, 10^5 per mm^3. The wall shear rate is 500 s^-1. Each color bar corresponds the three figures above it.
Credits: Karin Leiderman